OPERATIONAL ANALYSIS USING CAPELLA
Meeting Purpose: To produce operational analysis by using Capella software.
Meeting Date: 5/5/2021 (Wednesday)
Meeting Time: 9 P.M
Meeting Date: 5/5/2021 (Wednesday)
Meeting Time: 9 P.M
Meeting Location: MS Teams Platform
Meeting Facilitator: Mohamad Saifullah bin Zolkefly
Attendees: Muhammad Firdaus bin Khaled, Muhammad Nasir bin Aziz.
Decision Made:
1. Operational Entity Breakdown [OEBD]
Figure 1: OEBD.
4. Operational Entity Scenario [OES] - Machine Setup & Maintenance
Figure 4: OES - Machine Setup & Maintenance.
Discussion:
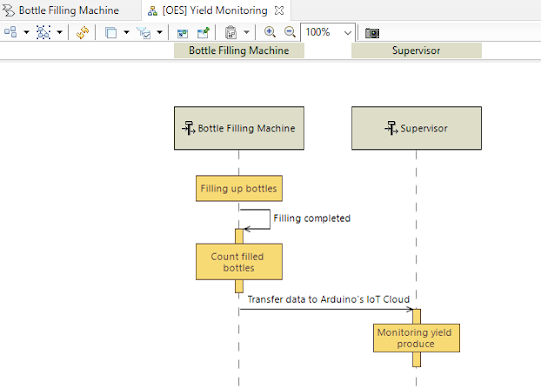
Figure 1 until 7 shows the Capella design of Operational Analysis. Figure 1 shows the design results for the Operational Entity Breakdown [OEBD] which consists of 3 actors (Operator, Supervisor & Technician) and 1 main entity (Bottle Filling Machine) with 2 sub-entities (Bottles & Liquid). Figure 2 shows the design results of Operational Capabilities [OCB] which consists of Liquid Bottling, Machine Setup & Maintenance, and Yield Monitoring. The details of this OCB then being elaborated in Operational Entity Scenario [OES] in Figures 3, 4, and 5. For Liquid Bottling, only the operator involves in this operation since they are required to placing the empty bottles on the conveyor. The empty bottles then moving through the conveyor until reached in front of the first IR Sensor. The interaction between this two actor and entity is named bottle placement. If the bottles are detected then the filling process begins. Meanwhile, for Machine Setup & Maintenance, the only technicians involve throughout the process. The technician is needed for machine setup for running different models of products and as well as to do the maintenance part if the machine is breakdown due to some undesirable things happens for example malfunction water pump and conveyor motor. For Yield Monitoring, only the Supervisor involve in this stage since they are the person responsible for monitoring the yield produce and to plan the next schedule of running products. In the Operational Activity Interaction Diagram [OAIB] as shown in Figure 6 is the complete process of the previous define operation is arranged nicely and then adding several processes named the filling process, the counting process, the setup process, maintenance process, and monitoring process. Last but not least is the overall design of the Operational Architecture Diagram [OAB] as shown in Figure 7. The OAB shows all the interconnection between all the actors and entities involve complete with the process that occurs.
Conclusion:
In the conclusion, the outcome we get is able to design the Operational Analysis for our project by using Capella. The main reference for the design is based on the context diagram of this project which has been described more in terms of process and interaction happens. Design by using Capella definitely make the process much easier but required a lot of time to practicing and understanding more about the MBSE tool.
Updated by: Mohamad Saifullah bin Zolkefly


No comments:
Post a Comment