Tuesday, 1 June 2021

Week 17

     Meeting Purpose: Finalize Final Report

Meeting Date: 2/6/2021(Wendnesday)

Meeting Time: 9.00 p.m

Meeting Location: MS Teams Platform

Meeting Facilitator: Muhammad Nasir bin Aziz

Attendees: Mohamad Saifullah bin Zolkefly, Muhammad Firdaus bin Khalid

Decision Made:

Division of report part

Discussion:

At the beginning of week 17, we have divided the task to each person in preparing the remaining report which is 2 chapters. Chapters 1 and 2 are ready to be merged in the 15th week.


Conclusion:


Chapter 3 which discusses the methodology is broken down into several parts, among which are input and output, flowchart and block diagram. Capella software is emphasized in this chapter. Step by step will be shown in the income of capella. Another software that is also used is proteus simulation for project demonstration use. Block diagram show the main processor input and output, interface to the internet. Types of architecture also show functional, physical and allocated.

Finally for chapter 4 is the results and discussion, this result is the result to Capella and Protues simulation, also discussed is the testing plan deployment and maintenance involved in this project.

Updated by: Muhammad Nasir bin Aziz

Friday, 28 May 2021

Week 16

      Meeting Purpose: Prepared Final Presentation

Meeting Date: 28/5/2021 (Saturday)

Meeting Time: 9.30 P.M

Meeting Location: MS Teams Platform

Meeting Facilitator: Muhammad Nasir bin Aziz

Attendees: Mohamad Saifullah bin Zolkefly, Muhammad Firdaus bin Khalid

Decision Made:

Division of presentation part

Discussion:

We have discussed together to divide the task in the slide presentation on the final day of the presentation. Each of them had to make a section for them to present handing it to Nasir to combine. Each person’s share is given according to the work they do. Points given to each person are equal. Once completed, a rehearsal was made the day before the presentation day, 28/5/2021 so that everything went smoothly as planned.

Conclusion:


figure show the Microsoft office team. The presentation on Friday went smoothly. Sir Zaki gave positive feedback. Our group was the first group required to start a presentation. Saifullah and Firdaus played a good role and were able to answer all the questions asked.

Updated by: Muhammad Nasir bin Aziz


Monday, 17 May 2021

Week 15

      Meeting Purpose: Logical Architecture

Meeting Date: 17/5/2021 (Monday)

Meeting Time: 6 P.M

Meeting Location: MS Teams Platform

Meeting Facilitator: Muhammad Nasir bin Aziz

Attendees: Mohamad Saifullah bin Zolkefly, Muhammad Firdaus bin Khalid

Decision Made:


Figure 1: show the solution architecture


Discussion:

·       To build a breakdown of the rough components of the system that brings the most important engineering results.

·       In order to include a function, one or more system decompositions into logical components must be constructed, each function being allocated to one component.

·       Starting from the analysis of previous functional and non -functional needs.

·       This logic component shifts to basic breakdowns for development / sub-contracting, integration, reuse, product and configuration management item definitions.


Conclusion:

The selected logical architecture, which is described by a functional description, components and justified interfaces definition, scenarios, modes, and states, as well as the formalisation of all viewpoints and how they are taken into account in the component design are all outputs of this engineering phase.

Updated by: Muhammad Nasir bin Aziz


Friday, 14 May 2021

Week 14

 PROTEUS DESIGN & SIMULATION


Meeting Purpose:         To produce Proteus design & simulation for the project.
Meeting Date:               12/5/2021 (Wednesday)
Meeting Time:              9 P.M
Meeting Location:        MS Teams Platform
Meeting Facilitator:     Mohamad Saifullah bin Zolkefly
Attendees                    Muhammad Firdaus bin Khaled, Muhammad Nasir bin Aziz.

Decision Made:
1. Finalized all components
        - The main components used are 6 push-buttons, 2 motors (conveyor & water pump), Arduino Nano, buzzer, and LCD.

2. Proteus Design:


Figure 1: Proteus design for the project.
3. Proteus Simulation:


Discussion:
    Figure 1 shows the Proteus design to illustrate the operation of our bottle filling machine. The setup push button is placed at the bottom left which consists of Start, Stop, Up, and Set Timer. The other push button is for IR sensors 1 and 2. IR S1 used to detect the presence of empty bottles before the filling process. If the IR S1 detects the bottle, it sends a command to the Arduino Nano to stop the conveyor and then turn on the water pump for the filling process. The filling process depends on the setting timers parameters. After done filling, the water pump then turns off back and the conveyor motor starts to move back. The filled bottle then moves in front of IR S2 for the counting process. This process repeating until the machine is turned off. The design also comes with an adjustable timers button for setting up the timers according to the required time for the filling process.

Conclusion:
In the conclusion, the outcome we get is able to complete the design for the simulation stage using proteus. All the execution program and simulation phases are working just fine as planned.

Updated by: Mohamad Saifullah bin Zolkefly

Friday, 7 May 2021

Week 13

 OPERATIONAL ANALYSIS USING CAPELLA


Meeting Purpose:         To produce operational analysis by using Capella software.
Meeting Date:               5/5/2021 (Wednesday)
Meeting Time:              9 P.M
Meeting Location:        MS Teams Platform
Meeting Facilitator:     Mohamad Saifullah bin Zolkefly
Attendees                    Muhammad Firdaus bin Khaled, Muhammad Nasir bin Aziz.

Decision Made:
1. Operational Entity Breakdown [OEBD]


Figure 1: OEBD.

2. Operational Capabilities [OCB]


Figure 2: OCB.

3. Operational Entity Scenario [OES] - Liquid Bottling


Figure 3: OES - Liquid Bottling.

4. Operational Entity Scenario [OES] - Machine Setup & Maintenance


Figure 4: OES - Machine Setup & Maintenance.

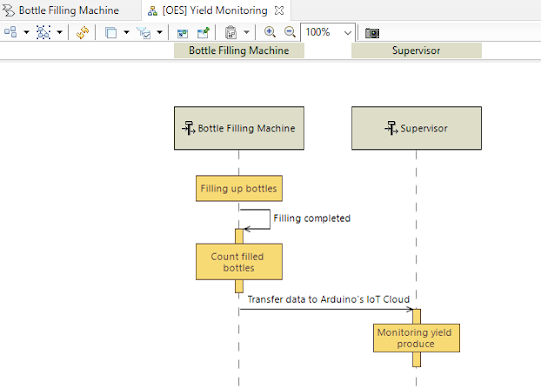
5. Operational Entity Scenario [OES] - Yield Monitoring


Figure 5: OES - Yield Monitoring.

6. Operational Activity Interaction Diagram [OAIB]


Figure 6: OAIB.

7. Operational Architecture Diagram [OAB]


Figure 7: OAB.

Discussion:
    Figure 1 until 7 shows the Capella design of Operational Analysis. Figure 1 shows the design results for the Operational Entity Breakdown [OEBD] which consists of 3 actors (Operator, Supervisor & Technician) and 1 main entity (Bottle Filling Machine) with 2 sub-entities (Bottles & Liquid). Figure 2 shows the design results of Operational Capabilities [OCB] which consists of Liquid Bottling, Machine Setup & Maintenance, and Yield Monitoring. The details of this OCB then being elaborated in Operational Entity Scenario [OES] in Figures 3, 4, and 5. For Liquid Bottling, only the operator involves in this operation since they are required to placing the empty bottles on the conveyor. The empty bottles then moving through the conveyor until reached in front of the first IR Sensor. The interaction between this two actor and entity is named bottle placement. If the bottles are detected then the filling process begins. Meanwhile, for Machine Setup & Maintenance, the only technicians involve throughout the process. The technician is needed for machine setup for running different models of products and as well as to do the maintenance part if the machine is breakdown due to some undesirable things happens for example malfunction water pump and conveyor motor. For Yield Monitoring, only the Supervisor involve in this stage since they are the person responsible for monitoring the yield produce and to plan the next schedule of running products. In the Operational Activity Interaction Diagram [OAIB] as shown in Figure 6 is the complete process of the previous define operation is arranged nicely and then adding several processes named the filling process, the counting process, the setup process, maintenance process, and monitoring process. Last but not least is the overall design of the Operational Architecture Diagram [OAB] as shown in Figure 7. The OAB shows all the interconnection between all the actors and entities involve complete with the process that occurs.

Conclusion:
In the conclusion, the outcome we get is able to design the Operational Analysis for our project by using Capella. The main reference for the design is based on the context diagram of this project which has been described more in terms of process and interaction happens. Design by using Capella definitely make the process much easier but required a lot of time to practicing and understanding more about the MBSE tool. 

Updated by: Mohamad Saifullah bin Zolkefly


Monday, 26 April 2021

Week 12

      Meeting Purpose: Allocated Architecture

Meeting Date: 26/4/2021(Monday)

Meeting Time: 9 P.M

Meeting Location: MS Teams Platform

Meeting Facilitator: Muhammad Nasir bin Aziz

Attendees: Mohamad Saifullah bin Zolkefly, Muhammad Firdaus bin Khalid

Decision Made:


Figure 1: Allocated architecture

Discussion:

Figure 1 shows the allocated architecture, the process for automatic bottle filling machine can be seen through this figure. F which means function indicates the function on the Physical found in the project. Starting from the machine is turned on at F1 with a power supply and ending with data monitoring on the Cloud.


Conclusion:

The combination of Functional Architecture and Allocated Architecture is closely related in producing allocated architecture.

Updated by: Muhammad Nasir bin Aziz


Monday, 19 April 2021

Week 11

Meeting Purpose: Type of architecture framework

Meeting Date: 19/4/2021 (Monday)

Meeting Time: 9 P.M

Meeting Location: MS Teams Platform

Meeting Facilitator: Muhammad Nasir bin Aziz

Attendees: Mohamad Saifullah bin Zolkefly, Muhammad Firdaus bin Khalid

Decision Made:

Functional Architecture

        The functional architecture is performed mainly at the start of the systems engineering project effort. It describes the functions, or actions, that must be performed while completing the system’s objective or mission.


Figure 1: Functional Architecture


Physical Architecture

        Physical architecture is the actual system components and subsystems are developed. These are typically in a physical block diagram that shows the actual components that make up the system. The components may also be grouped together that make up the subsystem. The subsystems may also be grouped together to make up the system.


Figure 2: Physical Architecture


Allocated Architecture


Figure 3: Allocated Architecture

Discussion:

Figure 3 show where the functions and physical architectures merge, in order to determine if we have all the functions and physical components properly allocated. This is a simple accounting of which functions are performed by which components within the system.

Conclusion: We know how to design the architecture framework by using functional, physical, and allocated.

Updated by: Muhammad Nasir bin Aziz


Thursday, 8 April 2021

Week 10

 FLOWCHART OF THE PROJECT


Meeting Purpose:         To produce a flowchart for the automatic bottle filling machine
Meeting Date:               7/4/2021 (Wednesday)
Meeting Time:              9 P.M
Meeting Location:        MS Teams Platform
Meeting Facilitator:     Mohamad Saifullah bin Zolkefly
Attendees                    Muhammad Firdaus bin Khaled, Muhammad Nasir bin Aziz.

Decision Made:
 1. Flowchart:
Figure 1: Project flowchart.
Discussion:
    Figure 1 shows the finalized version of the flowchart used in this project. The flowchart is basically on the running operation for the filling machine. The process begins when the machine is turned on by the users or operator. MCU then starts to execute the machine programs by turn on the DC motor for moving the conveyor. At this stage, operators can start placing the empty bottle or monitoring and fix the position of the bottle nicely before entering the filling section. If the bottle has reached in front of the IR sensor then the sensor going to send the signal to the MCU for turning off the conveyor. The filling process begins when MCU turns on the water pump for 5 seconds and then turns off back. The timers are not a constant parameter for this project since it just an example taken for 500 ml bottles. If there are bigger bottles used, therefore the timers need to adjust a little bit by increasing the filling times. In other words, the timers used in this project are adjustable for the multipurpose filling process. After the filling process is done, MCU going to turn on back the conveyor motor for the next operation. During the movements, if the bottles reached in front of the second IR sensor, then the completed filling process is count. The counting data then being transfer to the Arduino IoT Cloud based which is in the Blynk. The supervisor can monitor the counting yield in the Blynk platform either on the smartphone or the computer.

Conclusion:
In the conclusion, the outcome we get is able to finalize the project flowchart. The flowchart consists of multiple input and output processes for the filling machine operation. 

Updated by: Mohamad Saifullah bin Zolkefly


Friday, 2 April 2021

Week 9

 CONTEXT DIAGRAM OF THE PROJECT


Meeting Purpose:         To produce a context diagram for the bottle filling machine
Meeting Date:               31/3/2021 (Wednesday)
Meeting Time:              9 P.M
Meeting Location:        MS Teams Platform
Meeting Facilitator:     Mohamad Saifullah bin Zolkefly
Attendees                    Muhammad Firdaus bin Khaled, Muhammad Nasir bin Aziz.

Decision Made:
1. Types of Actors involve
        - For certain operations, there are several actors involved. The actor is basically a human being who is responsible for a specific task. In this project, there are 3 actors involve which consist of the operator, supervisor, and maintainer. All of these 3 actors performing their designated roles which been stated in their job description.

2. Types of Entities involve
        - The entities consist of an object that involves in this project. These entities consist of mechanical parts such as the conveyor motor and water pump. 

3. Context Diagram

Figure 1: Project context diagram.
Discussion:
    Figure 1 shows the finalized version of the context diagram used in this project. The actors consist of the operator which responsible for bottle placement onto the conveyor, the maintainer which responsible for maintaining the machine in good condition, and the supervisor who is responsible for monitoring yield for documentation purposes. The energy source uses is electrical energy for operating the MCU, sensors, and other mechanical parts. For MCU operation, the required operating signal is coming from the IR sensors which are used to sense the bottle's presents and then being processed by the MCU to produce outputs process in form of controlling the conveyor motor and the water pump.

Conclusion:
In the conclusion, the outcome we get is able to finalize the project context diagram as well as gain our basic knowledge about producing the context diagram.

Updated by: Mohamad Saifullah bin Zolkefly


Friday, 26 March 2021

Week 8

 BlOCK DIAGRAM OF THE PROJECT


Meeting Purpose:         To produce a block diagram for the automatic bottle filling machine
Meeting Date:               24/3/2021 (Wednesday)
Meeting Time:              9 P.M
Meeting Location:        MS Teams Platform
Meeting Facilitator:     Mohamad Saifullah bin Zolkefly
Attendees:                     Muhammad Firdaus bin Khaled, Muhammad Nasir bin Aziz.

Decision Made:
1. Types of Microcontroller to be used for replacing PLC
        - There are multiple types of microcontrollers that can be used to replacing PLC depends on the required operation. For example, Arduino microcontroller: Arduino UNO, Arduino Mega, Arduino Nano, Arduino Lily, Arduino Nano 33 IoT, etc. The Final decision made is by using Arduino Nano. 

2. Types of Microcontroller to be used for replacing PLC
        - The existing bottle filling machine comes with multiples designs for improving efficiency. For example, there are multiple designs of the assembly lines, conveyor systems, water tanks, filling nozzles and etc. The final decision made is to use two infrared sensors, a Wi-Fi module, a motor conveyor, and a water pump.

3. Block Diagram

Figure 1: Project block diagram.
Discussion:
    Figure 1 shows the finalized version of the block diagram used in this project. The input parts consist of 3 main components which are two IR sensors and one Wi-Fi Module. The first IR sensor is used to sense the presence of empty to stop the conveyor motor during the filling process. The second IR sensor used to count the complete yield produce after the filling process. The Wi-Fi module used to transfer the counting data to the Arduino IoT Cloud-based. Meanwhile, the selected MCU is the Arduino Nano which is responsible to execute all the programmed processes. Finally, at the output parts, there are 3 main components consist of a conveyor motor which is used to transport the bottles, the water pump which is used to pump the liquid for the filling process, and the IoT Cloud Blynk for yield monitoring purposes.

Conclusion:
In the conclusion, the outcome we get is able to finalize the project block diagram as well as gain our basic knowledge about multiples MCU that can be used as a PLC replacement in order to improve the existing process to the other such as monitoring using IoT.

Updated by: Mohamad Saifullah bin Zolkefly

Friday, 19 March 2021

Week 7

Meeting Purpose:       Tutorial exercises of voltage divider bias, CE BJT small-signal amplifier
Meeting Date:             19/3/2021 (Friday)
Meeting Time:             9.00PM
Meeting Location:       MS Teams Platform
Meeting Facilitator:    Muhammad Firdaus bin Khalid
Attendees:                    Mohamad Saifullah bin Zolkefly, Muhammad Nasir bin Aziz

Decision Made:


Discussion:

Voltage divider biasing configuration is the most widely used transistor biasing method. The emitter diode of the transistor is forward biased by the voltage value developed across resistor RB2. Also, voltage divider network biasing makes the transistor circuit independent of changes in beta as the biasing voltages set at the transistors base, emitter, and collector terminals are not dependent on external circuit values. To calculate the voltage developed across resistor RB2 and therefore the voltage applied to the base terminal we simply use the voltage divider formula for resistors in series.

We make a calculation to get the value of dc characteristics by using formula. To make sure the value of calculation is true so we construct the circuit of BJT small-signal amplifier in multisim and the result of IB, IC, IE and VCE almost same compare with calculation value.

Conclusion:

This week we know the how voltage divider bias is working. We also have learned how to calculate the dc & ac characteristics which is IB, IC, IE and VCE by using calculation and simulation.

Updated by: Muhammad Firdaus bin Khalid


Friday, 12 March 2021

Week 6

Meeting Purpose:         To determine the system requirements (what & why)
Meeting Date:               11/3/2021 (Thursday)
Meeting Time:              10.00PM
Meeting Location:        MS Teams Platform
Meeting Facilitator:     Muhammad Firdaus bin Khalid
Attendees:                     Mohamad Saifullah bin Zolkefly, Muhammad Nasir bin Aziz

Decision Made:

What:

  • Change microcontroller PLC to Arduino
  • Components and features added
  • Choose automatic bottle filling machine

Why:

  • Because Arduino is a latest technology can make the difficult concepts of programming and automation much easier to learn. It’s  also cheap compare to PLC.
  • Selecting the appropriate components in line with the functions of the features added to the project, namely IoT module, IR sensor and 1 channel relay module.

Discussion:

We are thinking about wanting to replace the PLC to Arduino Nano on what machine. After discussing we chose an automatic bottle filling machine. We also added some of the latest features, namely the internet of things (IoT) for monitoring the machine from a smartphone.

Conclusion:

We have archive the innovation at the existing product to develop a product which is PLC replacement.


Updated by: Muhammad Firdaus bin Khalid


Friday, 5 March 2021

Week 5

Meeting Purpose:         To learn how to make a context diagram
Meeting Date:               3/3/2021 (Wednesday)
Meeting Time:              9.30PM
Meeting Location:        MS Teams Platform
Meeting Facilitator:     Muhammad Firdaus bin Khalid
Attendees:                     Mohamad Saifullah bin Zolkefly, Muhammad Nasir bin Aziz

Decision Made:

Discussion:

  1. Users
  • User enter the ingredient
  • Users do finishing by packaging the bottles. 
      2. Maintainer
  • Maintainer need to inspect the machine before and after process. If have any problem they need to change parts problem. 
      3. Energy source
  • The machine use electrical energy to run the machine.
  •  Thermal energy is used for boil.
     4. Control box (PLC)
  • All the function of machine are control by control box.

Conclusion:
We have learned how to make a context diagram of mixture machine. We will use this information to make our project context diagram.

Updated by: Muhammad Firdaus bin Khalid